This is where you can do very flexible analysis of your deliveries. In the screenshot below, you can see a list of all the deliveries made to Pine Street in the first quarter of 2018. Click image to enlarge:
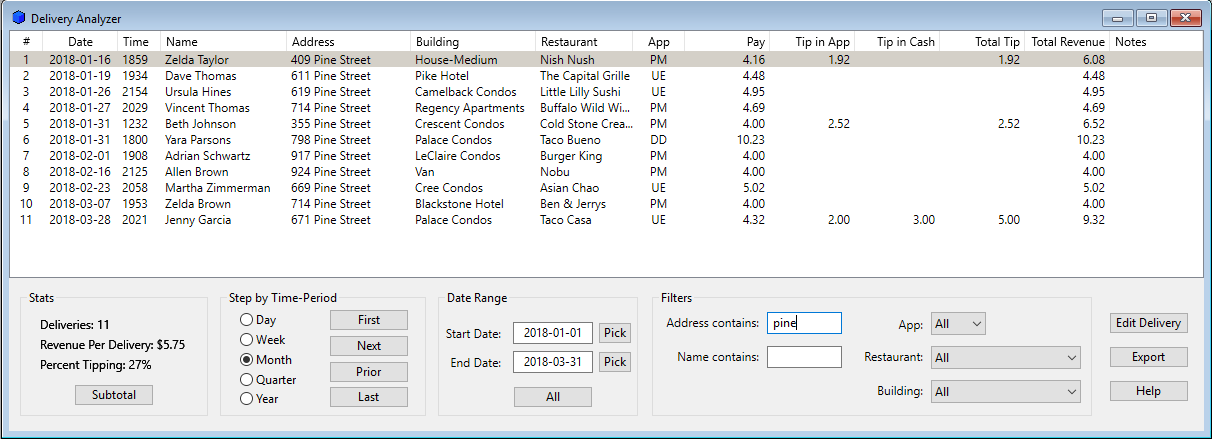
So, “pine” was typed into the address filter box, “January 1, 2018” was set as the starting date, and “March 31, 2018” was set for the ending date. Notice that you can also filter for customer name, app, restaurant, and building.
Now, suppose that you want to see deliveries for 2Q18. You could change the start- and end dates. But it is easier to click the “Quarter” radio button, and then click the “Next” button. The “Step by Time-Period” controls allow you to step back-and-forth through your data by your desired time-period. In this context, “Last” does not mean the previous time period, but rather the last time period in your database. So, if you had deliveries entered through June of 2018, and were looking at March of 2018 deliveries, and then you clicked the “Last” button, you wouldn’t go to “last month,” that is, February. Instead you would go to the last month in the database, so PizzaBoy would pull up your June 2018 deliveries.
You can sort the data by clicking on the column headers. Using the SHIFT and CONTROL keys on your keyboard, you can select more than one delivery, and then click the “Subtotal” button to see stats for just those deliveries. If you see an error, you can click on the delivery in the list, and then click the “Edit Delivery” button to fix it. The “Export” button will copy the deliveries in the list to your clipboard, and then you could paste them into an spreadsheet to do further analysis. If there is a long note in the “Notes” column of the list, you can click on it and PizzaBoy will open up a small window where you can see the entire note.