On this window, PizzaBoy will make several different charts of your data.
Click image to enlarge:
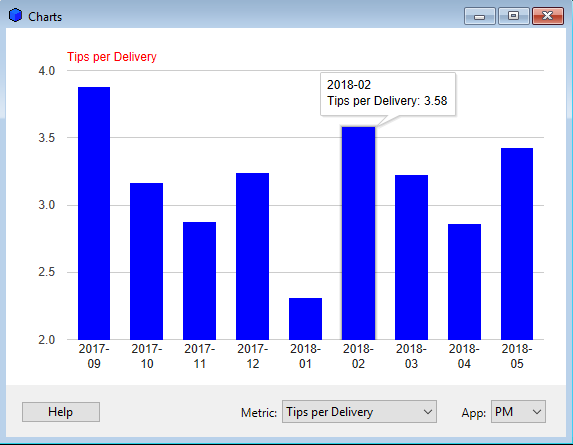
If you hover the mouse over a bar, it will show you the value of that bar.
Metrics are: Revenue (includes bonuses), deliveries, tips, cash tips, profit, expenses, revenue-per-delivery, tips-per-delivery, and profit-per-delivery. There are more metrics on the Metrics window.
Naturally, to see a chart of profits or expenses, you need to enter your data on the Expenses window.