Random Stock Grapher (RSG) is a free app designed for people studying the Random Walk Hypothesis of stock-market price fluctuations.
Download for Mac OS X
Download for Raspberry Pi 2
To use RSG on the Pi you need to install libwebkitgtk from the terminal:
sudo apt-get install libwebkitgtk-1.0.0
RSG uses the Google Chart API, so you need to be connected to the internet to use it.
In his book, A Random Walk Down Wall Street, Princeton economist Burton Malkiel wrote that stock chart-patterns are an illusion, and described an experiment to support his theory:
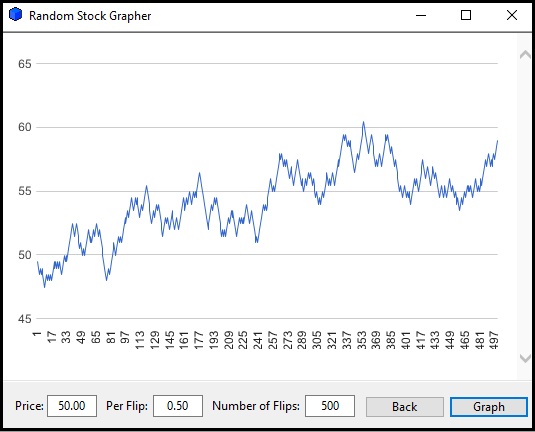
“The persistence of this belief in repetitive stock-market patterns is due to statistical illusion. To illustrate, let me describe an experiment in which I asked my students to participate. The students were asked to construct a stock chart showing the movements of a hypothetical stock initially selling at $50. For each successive trading day, the closing stock price would be determined by the flip of a coin. If the toss was a head, the students assumed that the stock closed ½ point higher than the preceding close. If the flip was a tail, the price was assumed to be down by ½.”
Malkiel went on to claim that charts produced by this method look remarkably like normal stock price charts. He only provided one example, and I wanted to see some more, so I wrote this app. RSG uses a random-number generator to simulate coin flips, and can make random charts far more swiftly. So, you can view random charts as fast as you can click the “Graph” button.
I provide this free app to promote my book: The General Theory of Day-Trading.
Version 1.0.0 of Random Stock Grapher was released on March 11, 2016.