The rising-wedge stock market pattern is a bearish development where prices rise, but in an ever-tightening formation.
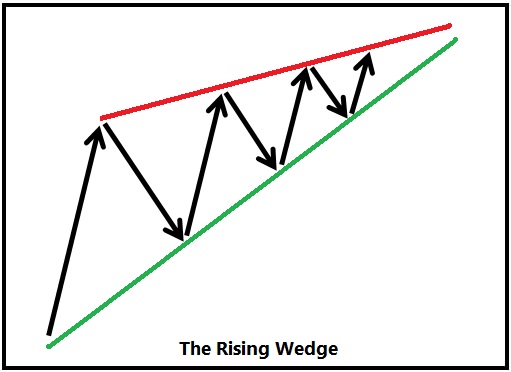
The buyers are eager to step in at the green line, but the sellers are just a bit more aggressive selling at the red line. So, you have a running battle where the bears are getting more bold, and the bulls are seeing more and more disappointing returns from their purchases at the green line. They just can’t punch through the red line. Eventually, the bulls pull their bids and the market drops.
On the chart below, we see a rising wedge on the 5-minute chart of the QQQ:
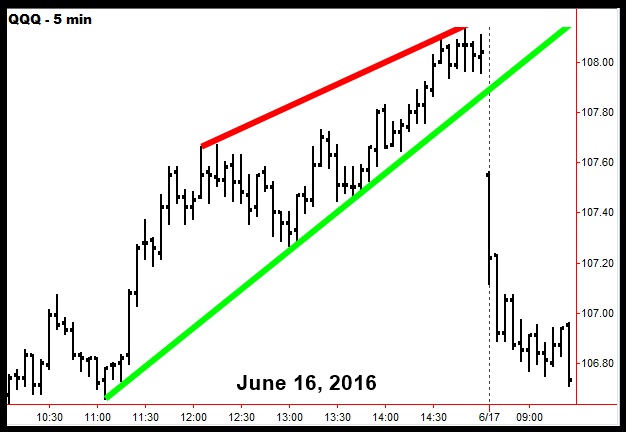
This particular wedge completed with a sudden snap. However, that is not always the case. The morphological sequence can play out in a few different variations, which I detail in Chapter 16 of my book: The General Theory of Day-Trading. I also have techniques for anticipating the emergence of wedges.