A chart gap is when a stock (index, futures contract, etc) opens higher or lower and then trades without coming back to the previous day’s closing price. The chart below shows a 15-minute candlestick chart of the IWM (Russel 2000 ETF) spanning two days:
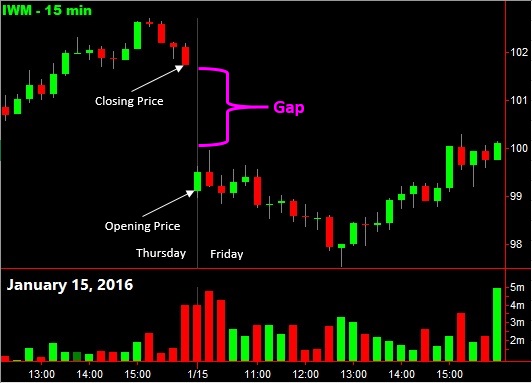
On Thursday, the IWM closed near 102. On Friday morning, it opened near 99. The sizeable gap is shown by the pink brace. The IWM rallied back a little bit and filled in some of the gap, but could only muster a close near 100. So, if you look at a daily chart of the IWM, the gap is still visible.
Today, such gaps are sort of artificial because of after-hours trading. However, they are still significant because after-hours trading is generally low-volume, and the large players have to wait until regular trading hours to make their large trades.
Gaps are the subject of an enormous amount of trader chatter, and there are several types of gaps, and several theories trying to explain their behavior.
In my book, The General Theory of Day-Trading, I discuss how to trade gaps, and put forth a new technique that can predict the occurrence of a dramatic type of gap called the mirror gap.