A breakaway gap is when a stock (index, currency, futures contract, etc) breaks out of a trading range with a powerful blast and doesn’t look back. On the chart below, we see Apple (AAPL) printing an impressive gap (green box) on January 28, 2015 (pink arrow) after having traded in a range (blue box) for several weeks:
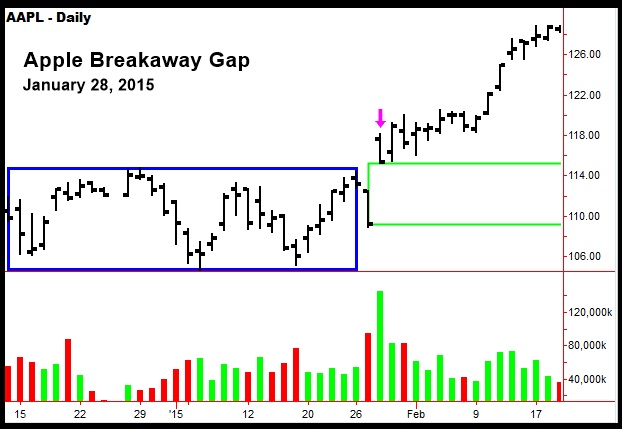
Notice that Apple did about twice its normal volume of trading on that day. That’s a strong indication that a powerful move is taking place.
Of course, not all breakaway gaps are to the upside. On the next chart, we see Apple printing a harrowing breakaway gap to the downside after a disappointing earnings report:
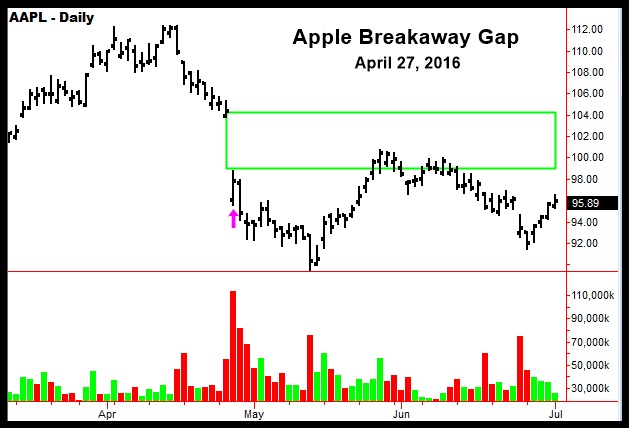
Apple opened down about $8 (pink arrow) on that day with huge volume, and was unable to fill the gap over the next couple of months.
Gaps aren’t always caused by dramatic events such as earnings reports. In many cases, it is just a matter of the supply or demand becoming exhausted. For a detailed discussion of this phenomena, see my book: The General Theory of Day-Trading.